OmniLab Smart Link Analytics
Run the per-link analytics view, choose a date range, and understand the main OmniLab Smart Link metrics.
Get a clear read on how one OmniLab Smart Link is performing, so you can decide where to put your next poster, email, or post. This page walks through how to open the analytics for a single link, what each number and chart means, and when to switch to the broader Reports table.
What this analytics view is for
OmniLab Smart Link analytics answers questions about one specific public link or QR code:
- How many times was it scanned?
- How many unique devices used it?
- Which variant performed best?
- Which sources, devices, and referrers appear most often?
This view covers one link at a time. When you need a CSV across many OmniLab Smart Links, use the Reports view instead.
Run analytics for a OmniLab Smart Link
Open the OmniLab Smart Link detail page
Go to the OmniLab Smart Link you want to review, then select See Full Analytics.
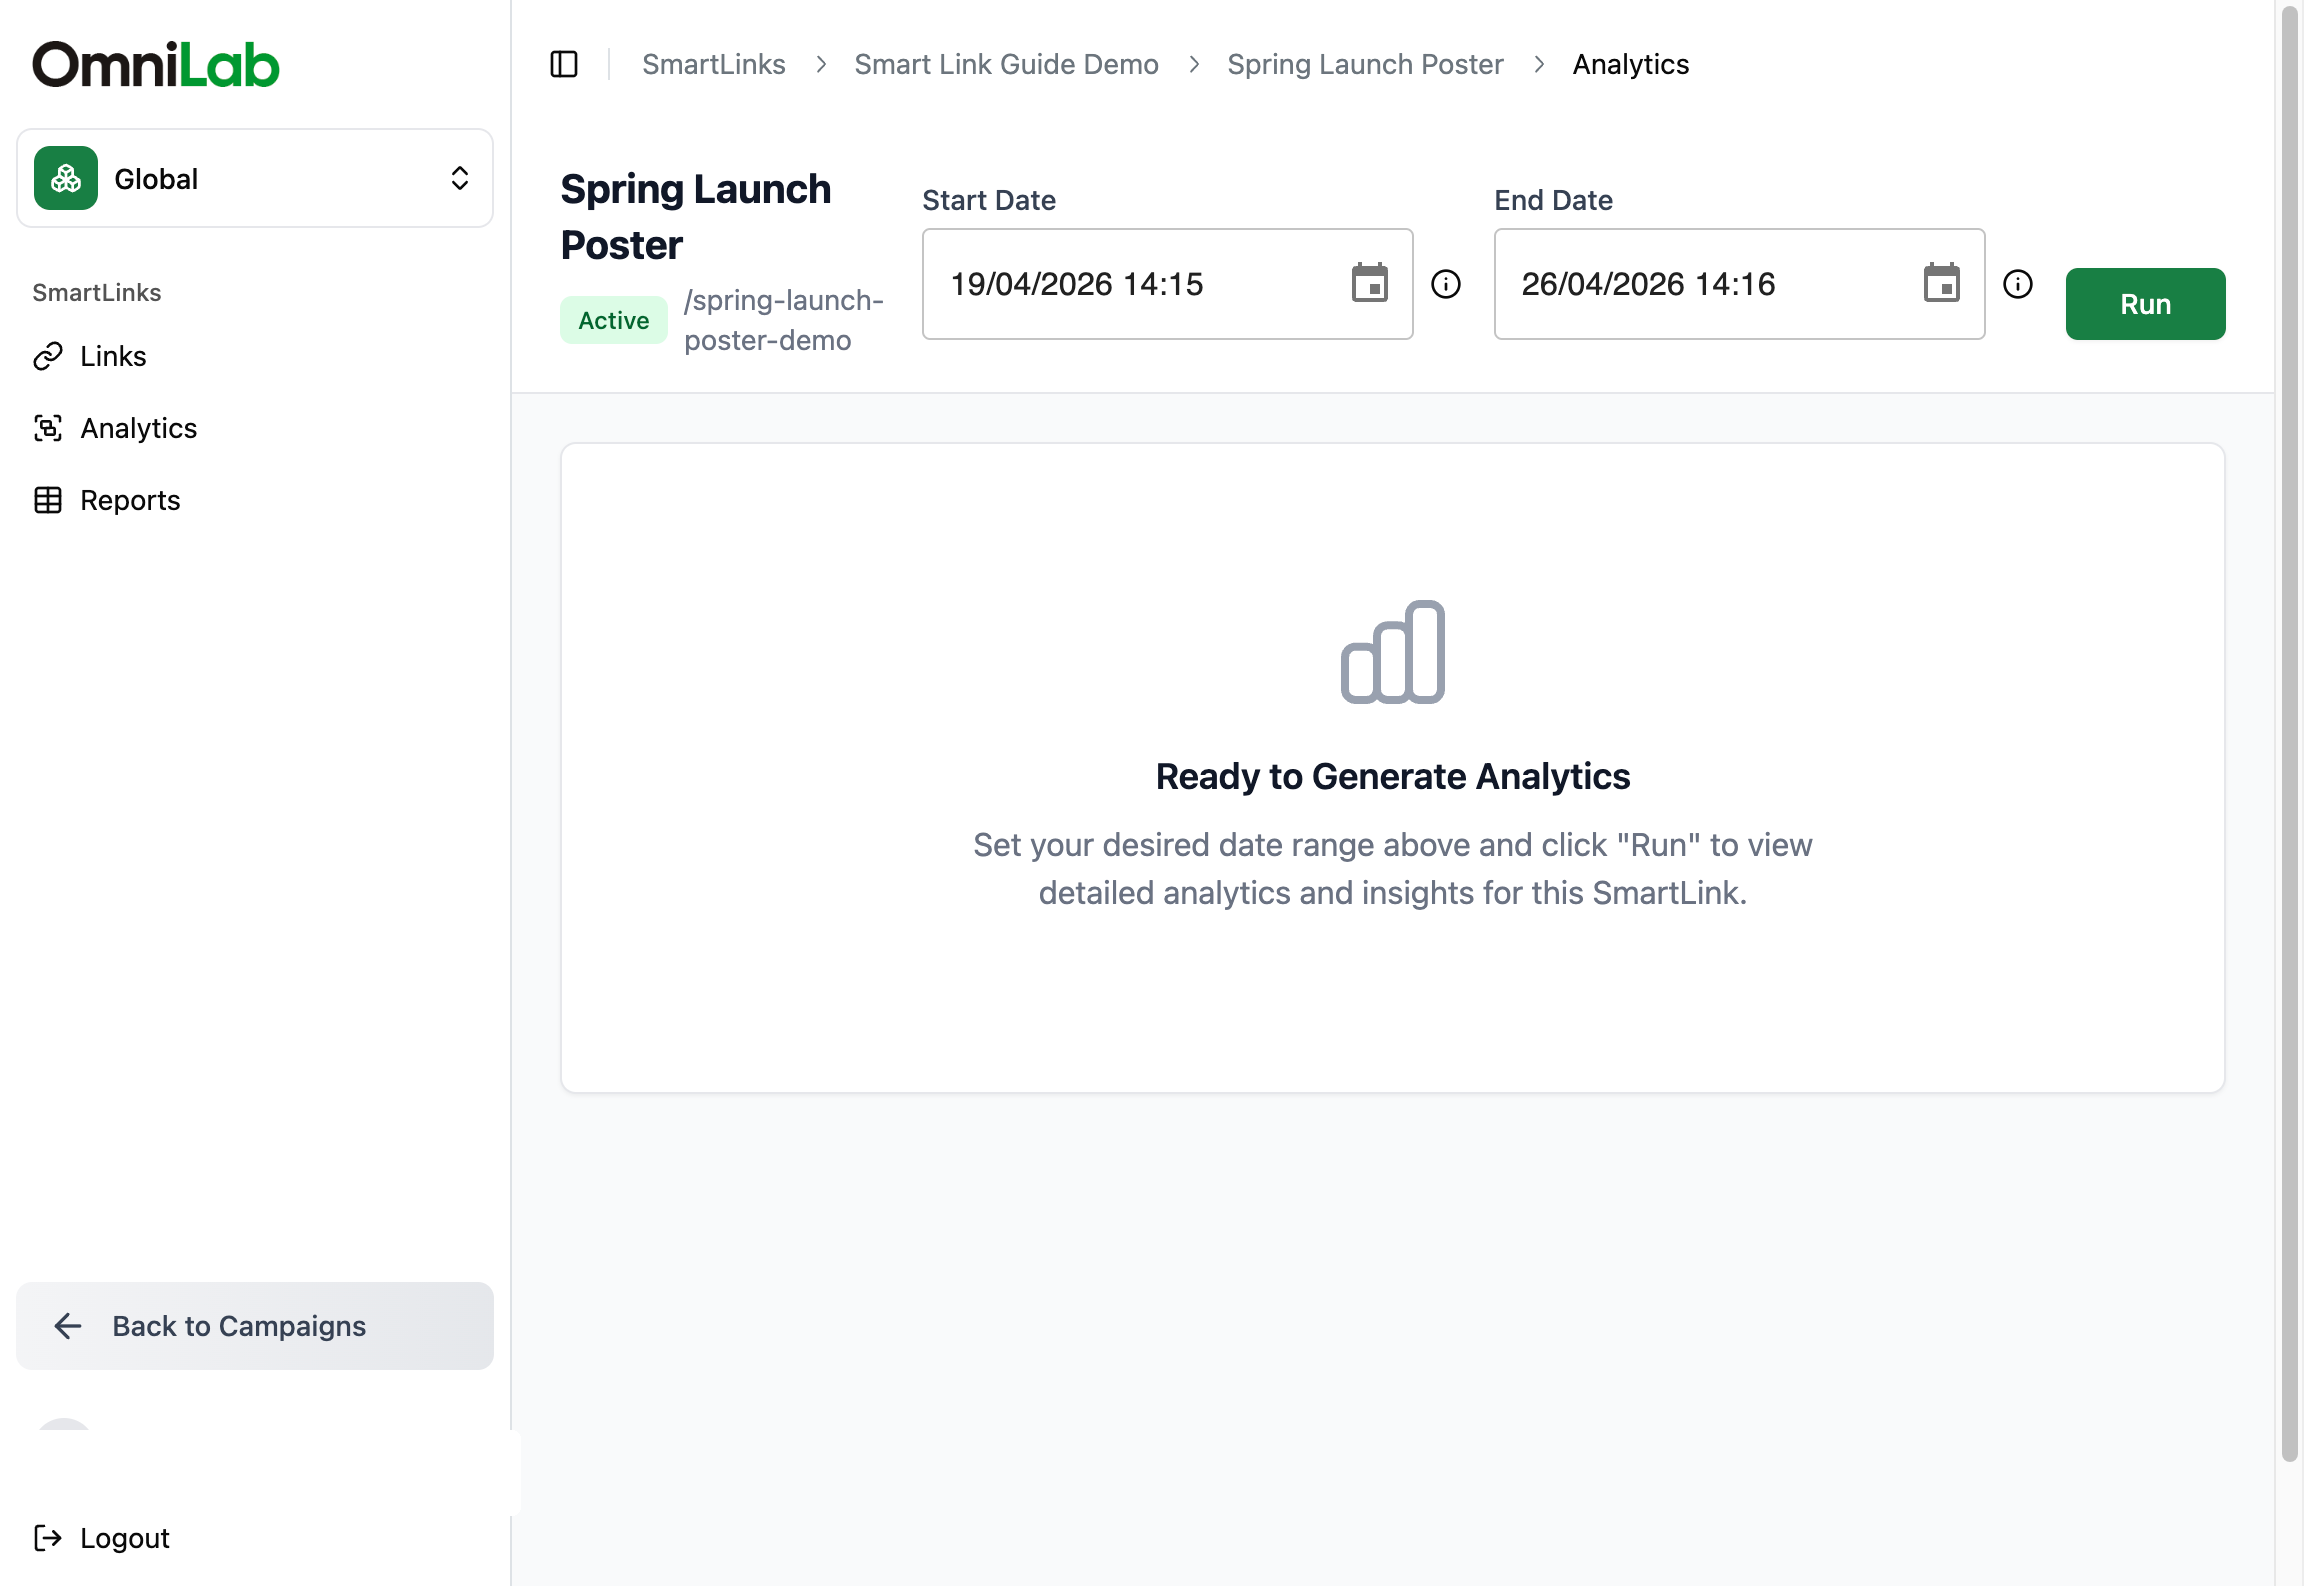
Set the reporting window
Choose a Start Date and an End Date for the period you want to analyze.
Run the report
Select Run to load the metrics and charts for the period you chose.
When you are reviewing a newly launched OmniLab Smart Link, set the date range to include the first test scans or the launch date itself.
The main numbers
At the top of the page, OmniLab shows three headline numbers:
| Metric | What it tells you |
|---|---|
| Number of scans | Total scan or click volume on the link in the selected period. Use this to gauge overall reach. |
| Unique devices | Approximate number of distinct devices recorded. Use this to estimate how many people you reached, not just total taps. |
| Avg. scans per device | How often the same device came back. Use this to spot repeat engagement. |
After you select Run, the page loads this top row and the charts below for the period you chose.
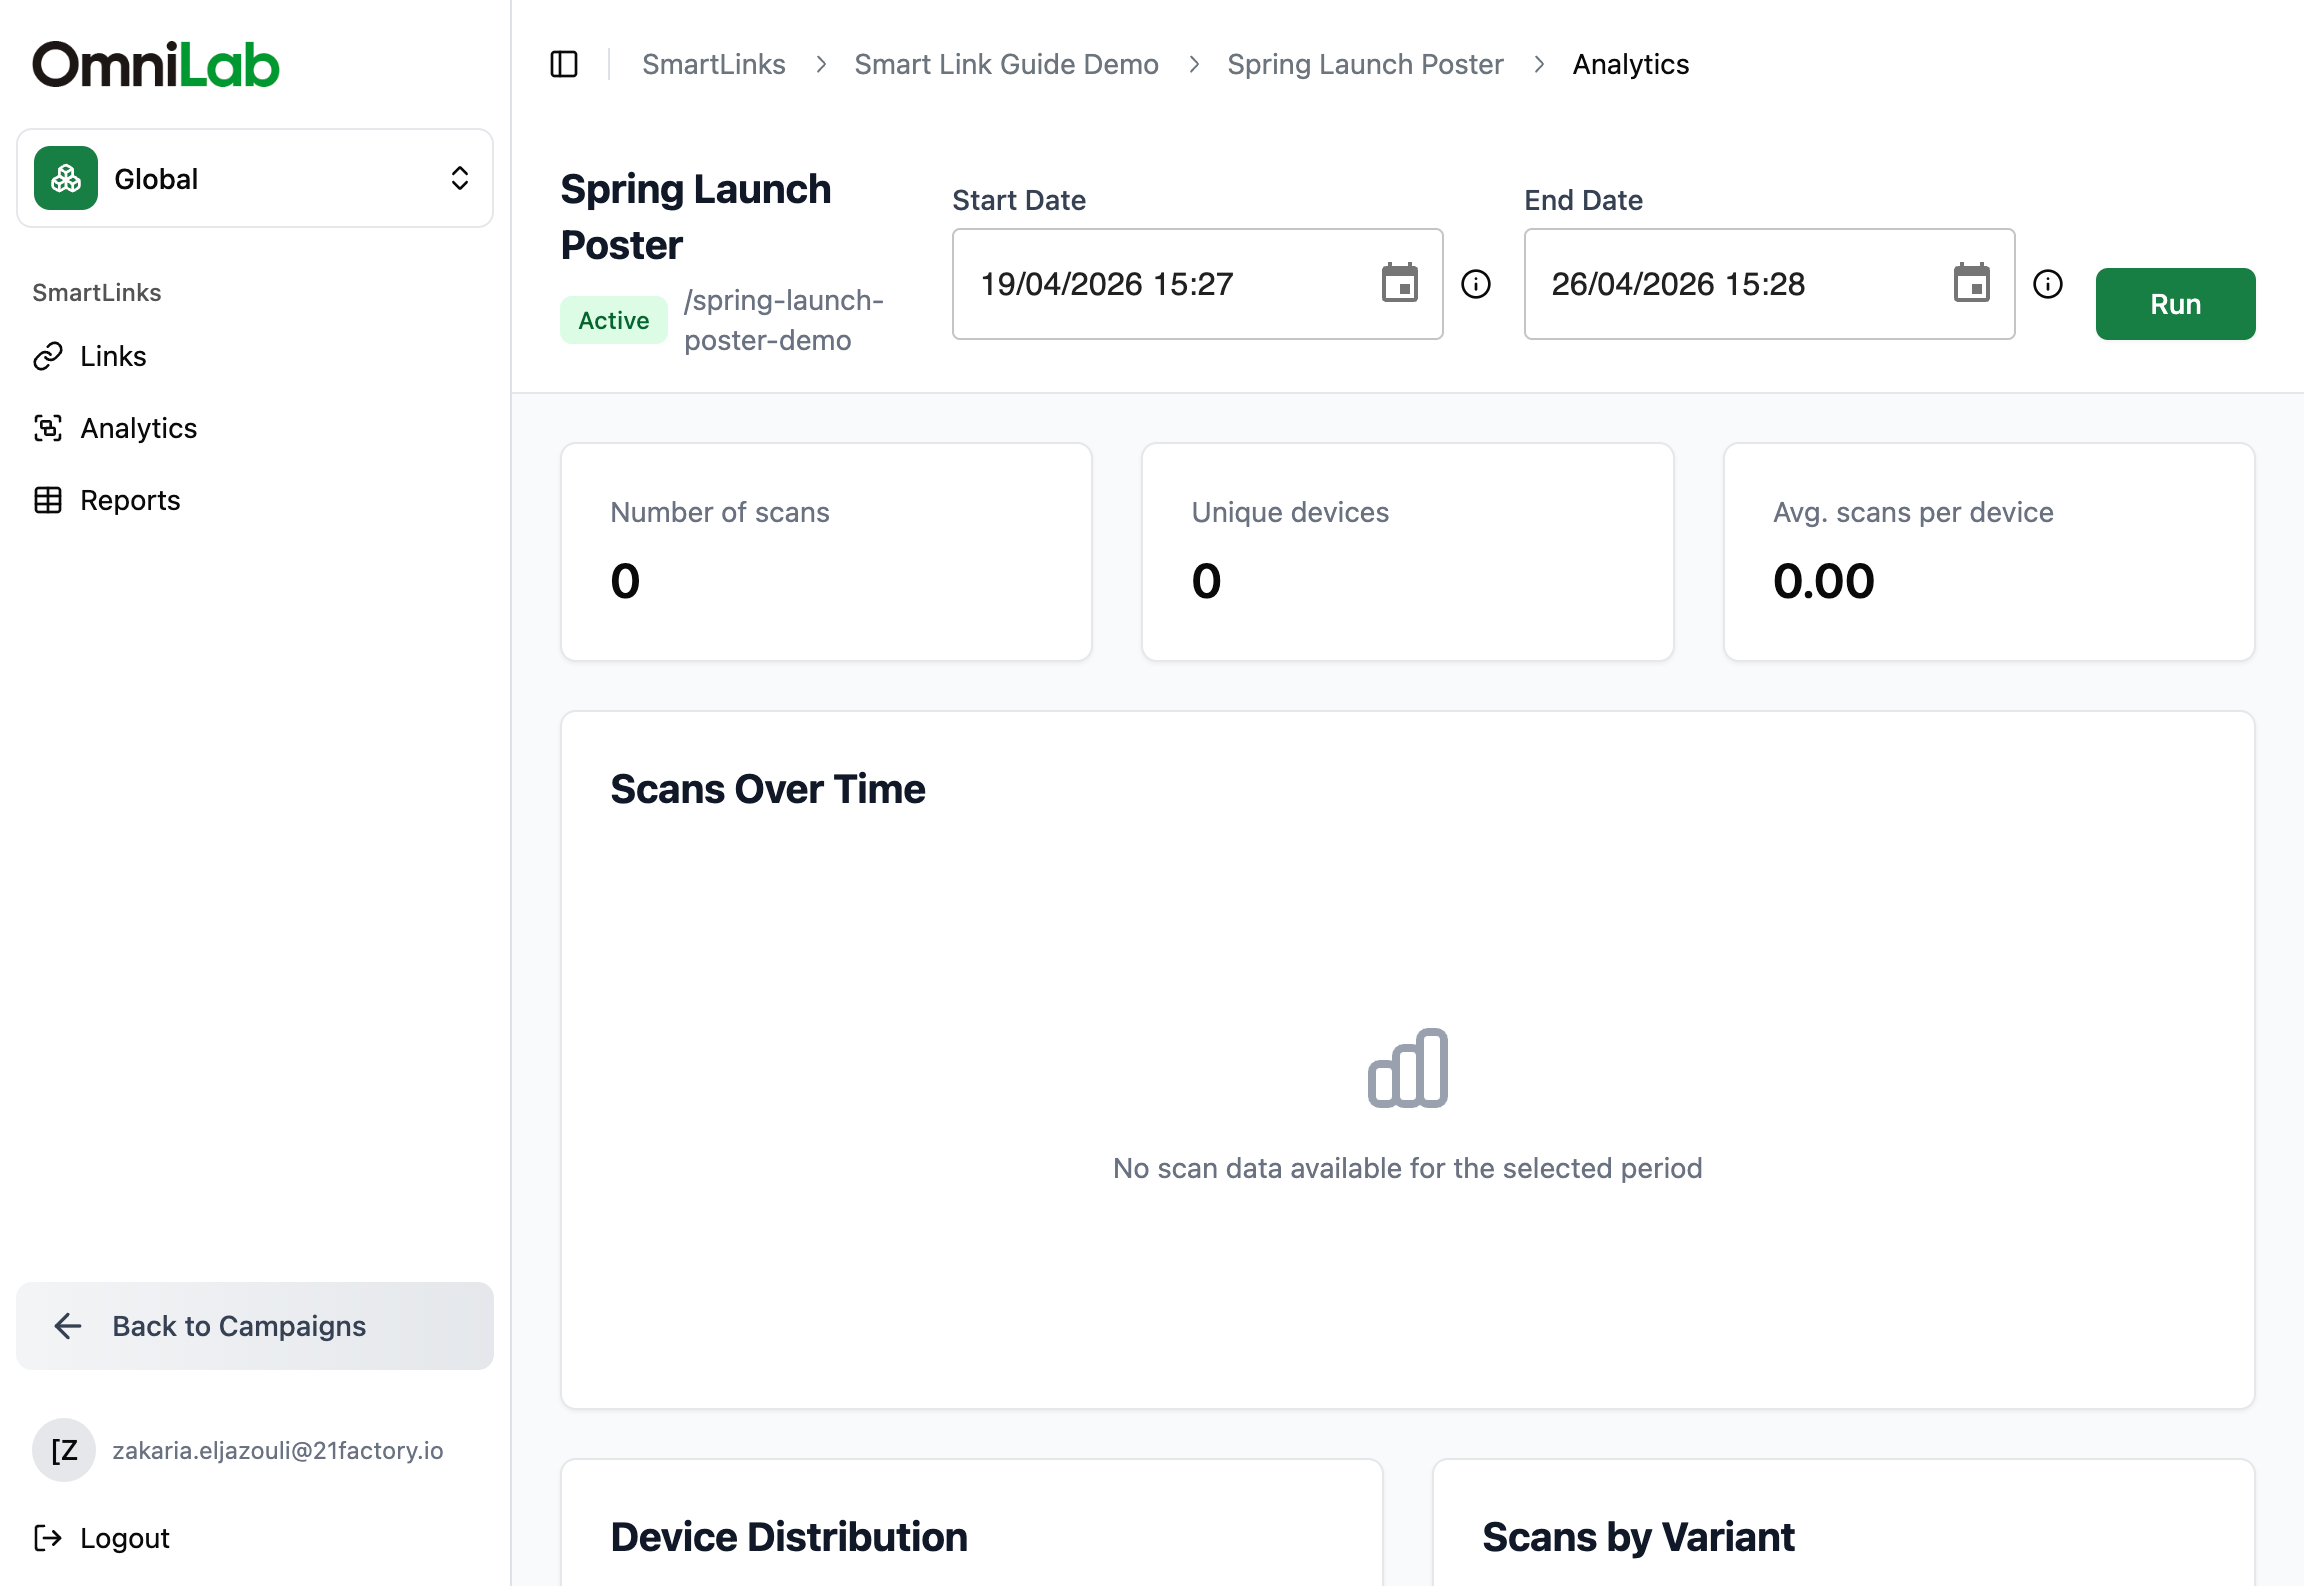
The charts and lists you will see
Below the headline numbers, the page breaks the traffic down in several ways. Each block answers a different question.
| Chart or list | Use it to find out |
|---|---|
| Scans Over Time | When traffic peaked, spiked at launch, or lost momentum |
| Device Distribution | Whether traffic is mainly mobile, desktop, or another device group |
| Scans by Variant | Which placement, channel, or location performed best |
| Top UTM Sources | Which tagged sources appear most often (the labels you added to track each channel) |
| Top Devices | Which device or browser families are most common |
| Top Referrers | Which websites sent traffic, when that information is available |
How to use the results
Use this page to make practical launch and distribution decisions:
- Compare one poster location against another with Scans by Variant.
- Spot high-traffic periods in Scans Over Time.
- Confirm that mobile dominates before you tune a destination page for small screens.
- Compare organic and tagged traffic with Top UTM Sources.
- See where referrals come from with Top Referrers, when that data is available.
When to use Reports instead
Use the Reports view when you need:
- a table across many OmniLab Smart Links
- a CSV export
- link-level fields such as slug, status, type, scans, unique devices, last activity, expiration date, or UTM values
Per-link analytics and Reports serve different jobs
Use this analytics page to understand one link deeply. Use Reports when you need a broader view across links or a CSV to work on outside OmniLab.
Related
Scans over time
Go deeper into the time-series chart and how to interpret launch peaks and traffic drops.
Scans by variant
Compare locations, channels, and placements under one OmniLab Smart Link.
Analytics exports
Use the Reports view and CSV export when you need link-level reporting outside the per-link analytics page.