Device distribution
Use device-level OmniLab Smart Link analytics to understand where scans come from and how to respond.
Find out whether your scans come mostly from phones or computers, so you can make the landing page feel right for the people actually arriving. This page explains how to read Device Distribution and Top Devices in OmniLab Smart Link analytics.
What Device Distribution shows
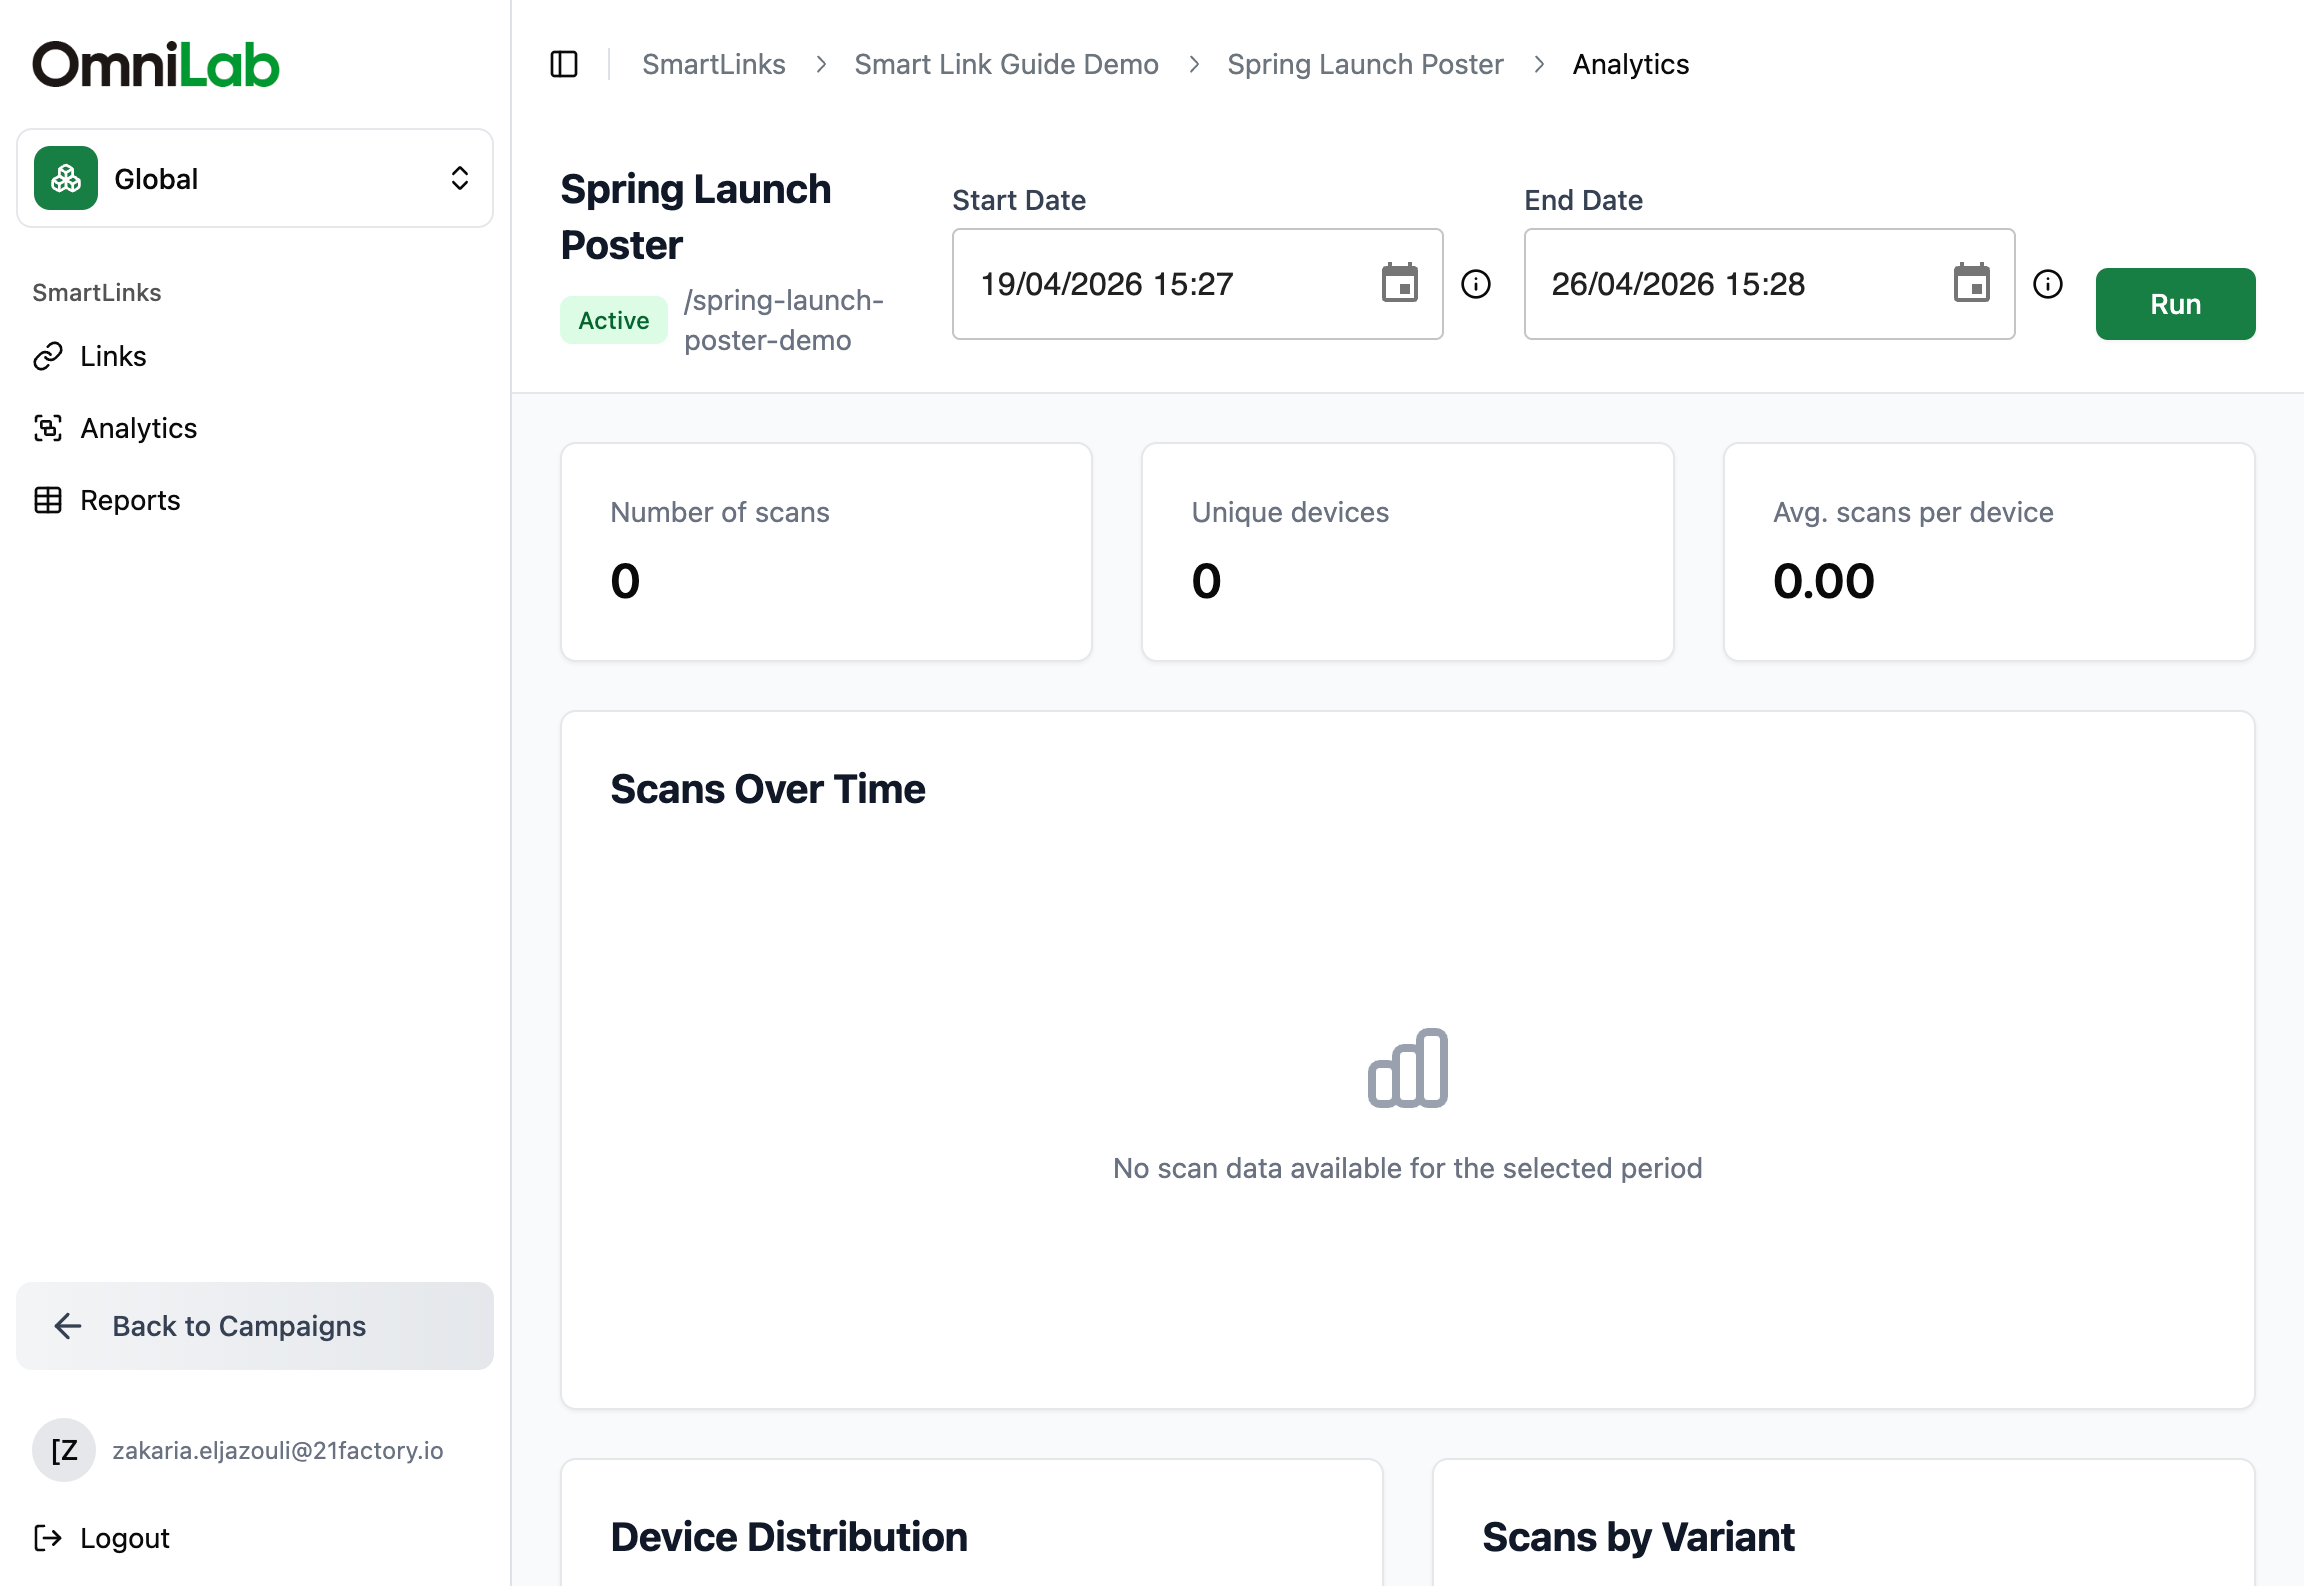
Device Distribution gives you a high-level split of the devices recorded for the OmniLab Smart Link and date range you selected.
Use it to see whether your audience arrives mainly from:
- mobile devices
- desktop devices
- other device groups in the report
For most QR-led campaigns, mobile traffic should dominate. When it does not, that is often worth a closer look.
Device Distribution and Top Devices appear in the analytics view alongside the other charts.
What Top Devices adds
Top Devices gives a more detailed ranked list than the high-level distribution chart.
Use the two together:
| Chart | Use this when |
|---|---|
| Device Distribution | You want a quick high-level split by device group |
| Top Devices | You want to see which device or browser families appear most often |
How to use this data
Device data helps you make practical decisions about the destination experience:
- If scans are mostly mobile, make sure the landing page, form, or destination is comfortable on a phone.
- If desktop traffic is higher than expected, the OmniLab Smart Link may be circulating in email, internal communications, or a non-QR context.
- If one device family dominates, test the final destination carefully on that device type.
Examples
Mostly mobile scans
This is common for posters, flyers, shelf wobblers, packaging, and other QR-led placements. In that case, prioritize:
- mobile landing page readability
- button placement
- shorter forms
- clear above-the-fold messaging
More desktop traffic than expected
This can happen when the OmniLab Smart Link is copied into newsletters, websites, or support materials. In that case, review:
- whether the landing page still makes sense outside a camera-scan context
- whether your tracking labels (UTM tags, the values you add to identify each channel) match where the link is really used
- whether you need separate variants for QR and non-QR placements
What device data does not tell you on its own
Device distribution is useful context, but it does not explain everything by itself. To read performance properly, compare it with:
- Scans Over Time
- Scans by Variant
- Top UTM Sources
- Top Referrers
That combination shows not only which devices appear, but also which placements and channels are driving them.
Related
OmniLab Smart Link Analytics
See where Device Distribution fits into the wider per-link analytics view.
UTM source and referrer analysis
Combine device data with channel clues to understand how traffic is arriving.
Test the OmniLab Smart Link
Test the real destination on the device types most common in your OmniLab Smart Link analytics.