Test and monitor functions
Run test invocations against the real sandbox, read the execution log, and diagnose failing or silent functions.
Run a function against a realistic payload before you wire it up, then use the execution log to see what actually happened when it ran for real. Both are in the function editor.
Run a test invocation
Open the function and use the Test tab. Testing requires status Ready — a function that has not built successfully has nothing to run.
Load a sample payload
Select Load example to drop in a payload matching the function's kind. Platform event functions get a full event envelope for any event type in the catalog, and hook functions get the typed input for their hook point.
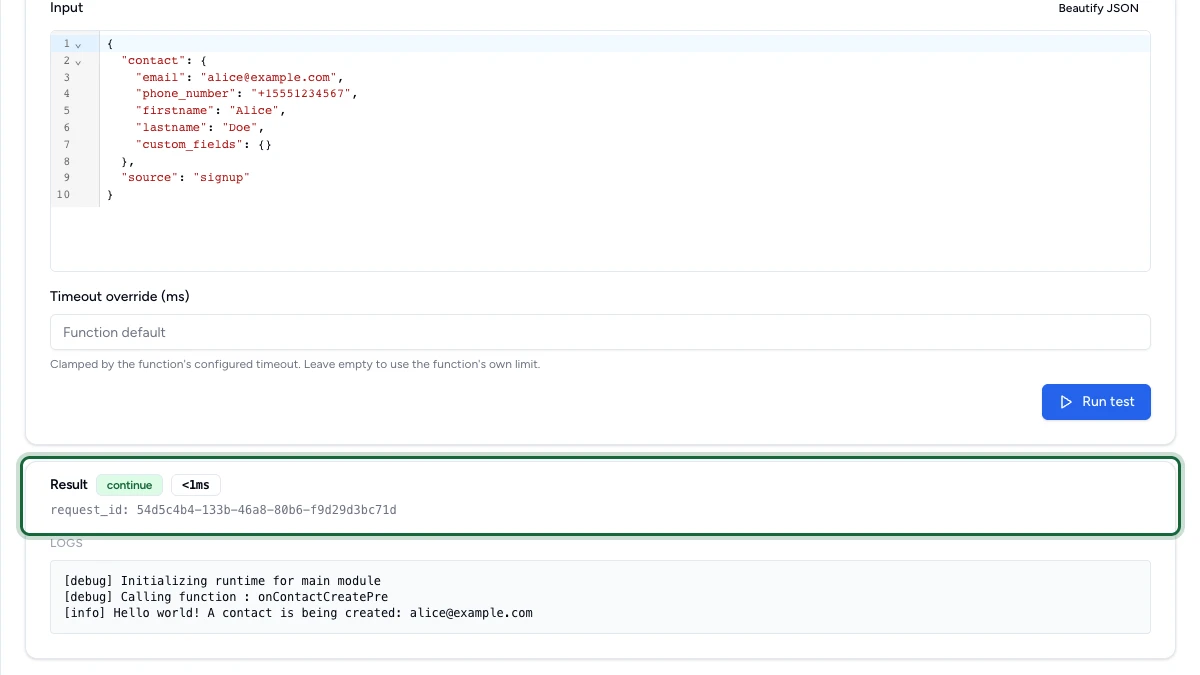
The input editor validates JSON as you type and marks the offending line if it cannot parse. Use Beautify JSON to reformat.
Timeout override (ms)
This field currently has no effect on a test run — the run always uses the function's own configured timeout, whatever value you enter here. Leave it empty.
Run it and read the result
Select Run test. What you see depends on the kind:
- Platform event functions show an exit code badge, the duration, the request id, and the output. Exit code
0with no error means success. - Hook shows the decision your handler returned — continue or deny — plus the code and message on a denial, and the result object it supplied.
Anything your handler logged with console.log and friends appears in a Logs panel below the result, alongside a couple of platform lines showing the runtime starting up and the handler being called.
A test invocation is a real invocation
Tests run in the real sandbox with the real SDK. An allow-listed HTTP request genuinely goes out, and a contact custom field write genuinely lands. Use test data, and be careful with hooks that call an external provider — a contact.verify test really sends an email.
Reading a hook contract violation
If your handler returns something the hook contract does not accept, the result shows a Contract violation panel instead of a decision. This is the failure mode to take most seriously: in production the same output causes OmniLab to deny the operation, because a hook that cannot be understood is treated as a refusal.
Common causes are returning a plain object instead of using OmniLab.Flow, denying without a code, or supplying a result field the hook point does not define.
Platform-event output is shown for debugging only
The Test tab displays what a platform-event function returned so you can inspect it. In production that value is discarded. If your function needs to have an effect, it must act through the SDK.
Read the execution log
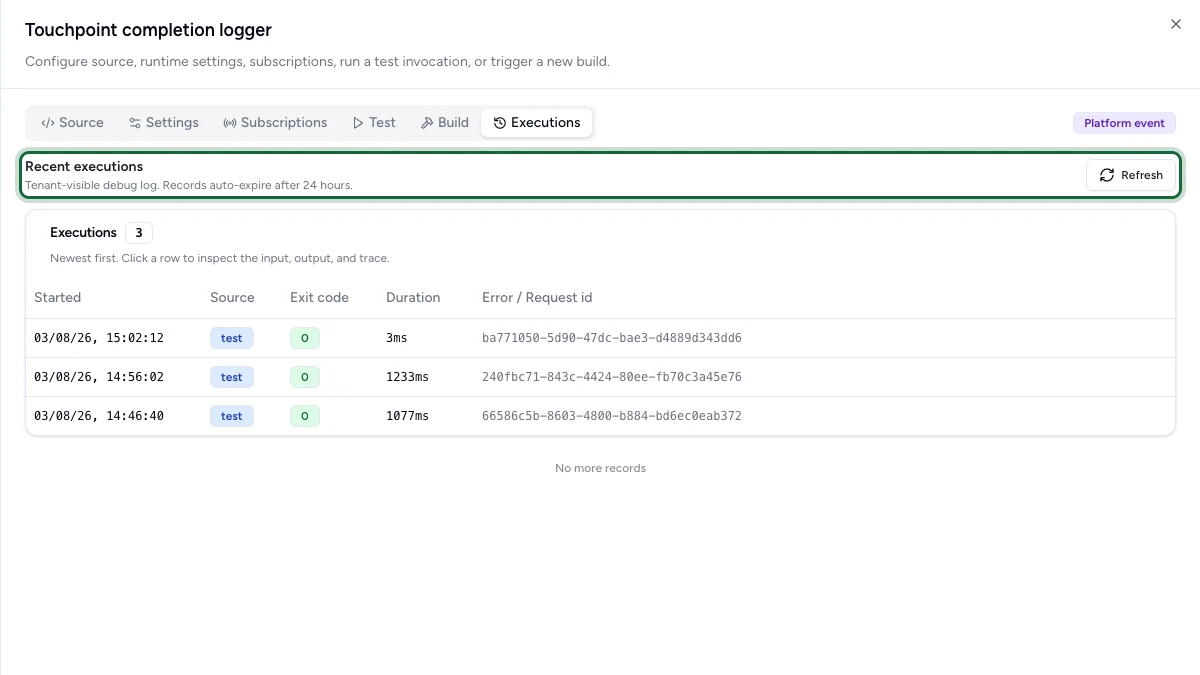
The Executions tab lists real invocations, newest first, and is the primary tool for answering "did it run, and what happened".
| Column | What it tells you |
|---|---|
| Started | When the invocation began |
| Source | How it was triggered — event, hook, or test |
| Exit code | 0 for success; anything else, or a populated error, means the run failed |
| Duration | End-to-end time for the invocation, so it can read much higher than the handler time shown on a test result |
| Error / Request id | The failure message, or the request id to quote to support |
Records are held for 24 hours and then expire, so capture anything you need for a post-mortem while it is still there. Keep each version of your handler in your own repository too — the platform tracks a version number and the compiled artifact, not your source history, so your repo is what lets you put the previous version back. The list loads 20 at a time with Load more, and Refresh pulls the newest.
Select a row to open its detail, which adds everything the platform recorded:
- The input and output as stored, capped at 256 KB per side. When either was longer, a banner reports the original sizes.
- The WASM sha — which compiled version actually ran. This is how you tell "my new code is broken" from "the old version is still serving".
- The full logs, or a truncated marker when your handler logged more than the capture allows.
- Trace metrics under a collapsible section: how many SDK calls the run made, memory used, and a breakdown of where the time went — waiting to start, getting ready to run, and running your code.
Use the phase breakdown before you optimize
If a function feels slow, check the trace metrics before touching your code. The time OmniLab spends preparing the first run after a change is not something your handler can influence, and it does not count against your timeout. Only the time attributed to your own code is yours to improve.
Likely causes when something is wrong
Still stuck?
Send support the request id from the failing execution and the build id from the Build tab. Execution records expire after 24 hours, so capture the detail view before then — including the input, the error, and the trace metrics.